A hospital department consisted of 13 teams and did not have a centralized uniform report to track specific metrics. Each team had to build separate ad hoc reports for the different financial and operational metrics. This required running up to 10 different reports from four different systems and then manually creating a formatted report requiring hours of work each time the report was needed.
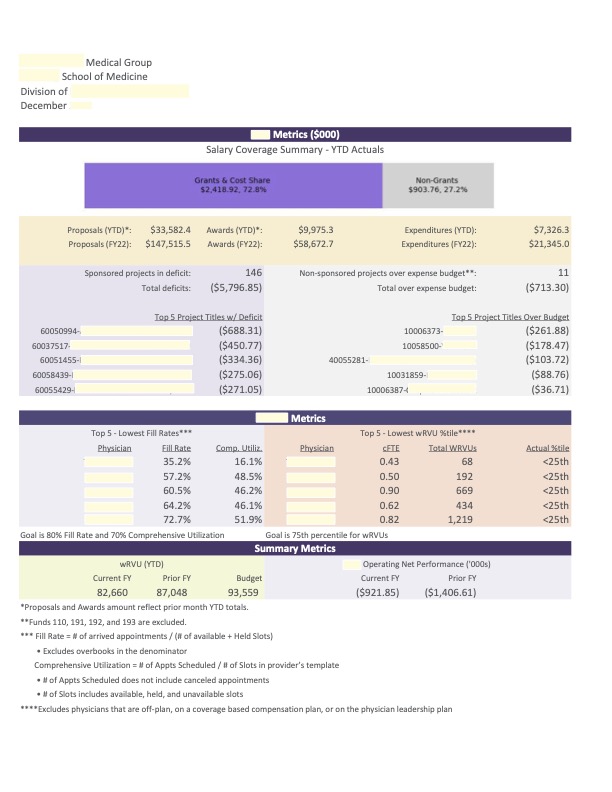
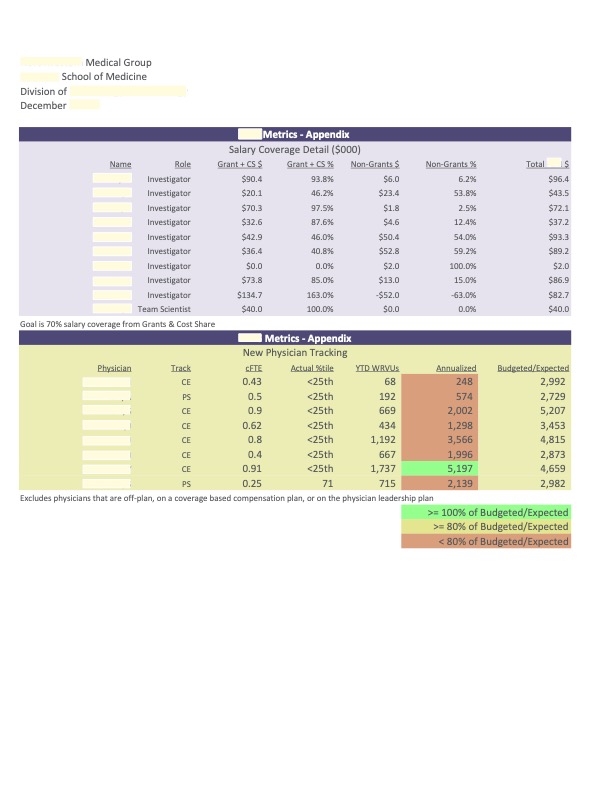
After several months of feedback driven iterations, the Python program to ingest the 10 reports and create a monthly recurring deliverable for each of the 13 teams was finished. The deliverable was ready in minutes, consisted of uniform metrics, and was reviewed during a monthly leadership meeting (see Exhibit 1). Some of the metrics included are:
- Total Dollar Amount YTD and Prior Year amounts for Research Proposals, Awards, and Expenditures
- Top five research grant-sponsored projects with a current deficit balance
- Top five non-sponsored projects over expense budget
- The five physicians with the lowest patient access metrics
- The five physicians with lowest clinical productivity compared to expectations
- Breakdown of salary sources (grants and cost share vs non-grant source) for physicians
- Clinical productivity metrics of newer physicians
Some of the impacts from this new report included:
- Taking corrective actions for grant or non-grant projects that were in a deficit position or over budget (i.e., reallocation of funds, invoice for money owed, etc.)
- Increase appointment blocks of time for a given physician to allow for more patients to be scheduled and seen
- Identify and fix billing issues so number of completed procedures and associated operational metrics is accurate· Identify physicians/faculty members who need additional sources of funds to cover their salary
- Identify physicians/faculty members who need additional sources of funds to cover their salary
Exhibit 1