The Problem: To create a KPI report for each 11 divisions in the department, a person must run 10 different reports from several software sources and combine the reports together using a series of pivots and formulas in Excel. Afterwards, the report has to be cut into the separate divisional reports and then spend time formatting the results of each report depending on the audience. It’s only after the report creation that analysis of the results can be made to determine corrective actions, make decisions, or identify further analysis that may be needed.
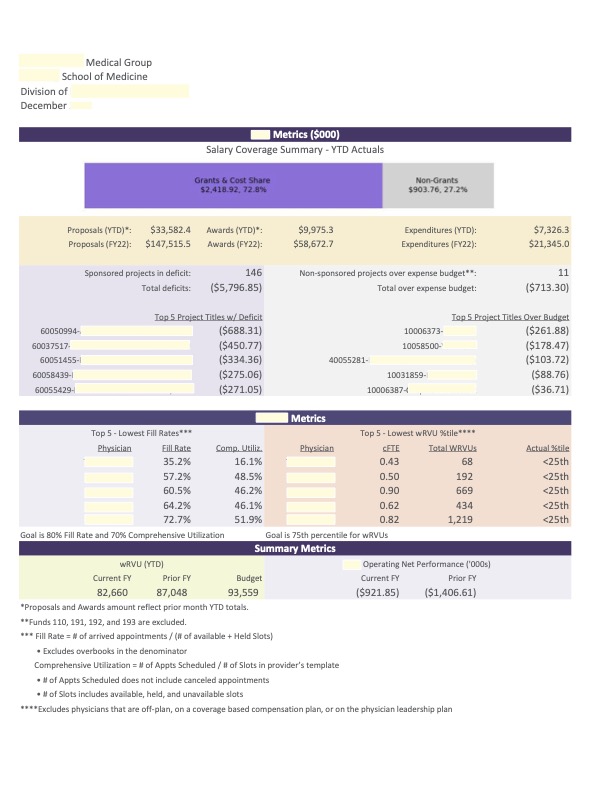
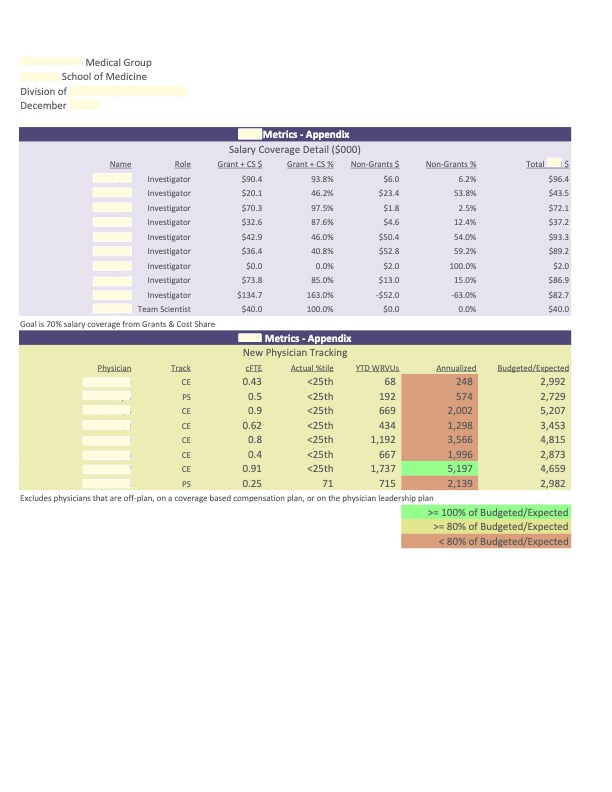
The Solution: A custom-made program built with Python that consumes the 10 different reports, automatically combines and transforms the data, and the collated results are placed in a pre-formatted output in Excel and pdf – all within minutes (Exhibit 1). The software allows the user to choose what period to run the reports for and what division(s) to run (Exhibit 2).